Project: Kalbe X Rakamin Data Scientist
Problem Statement
Inventory Team:
Predicting the sales quantity (quantity) for the overall Kalbe products.
- Knowing the estimated quantity of products sold, the inventory team can create sufficient daily stock supplies.
- The prediction should be done on a daily basis.
Marketing Team:
Creating clusters/segments of customers based on several criteria.
- Creating customer segments.
- The marketing team will use these customer segments to provide personalized promotions and sales treatment.
Tools:
- Python
- Jupyter Notebook
- Tableau
- Dbeaver
- PostgreSQL
Exploration with PostgreSQL and Dbeaver
Average Customer Age based on Marital Status:
- Married = 43
- Single = 29
Average Customer Age based on Gender:
- Woman = 40
- Man = 39
Sotre with Highest Total Quantity: Lingga
Top Product by Total Amount: Cheese Stick
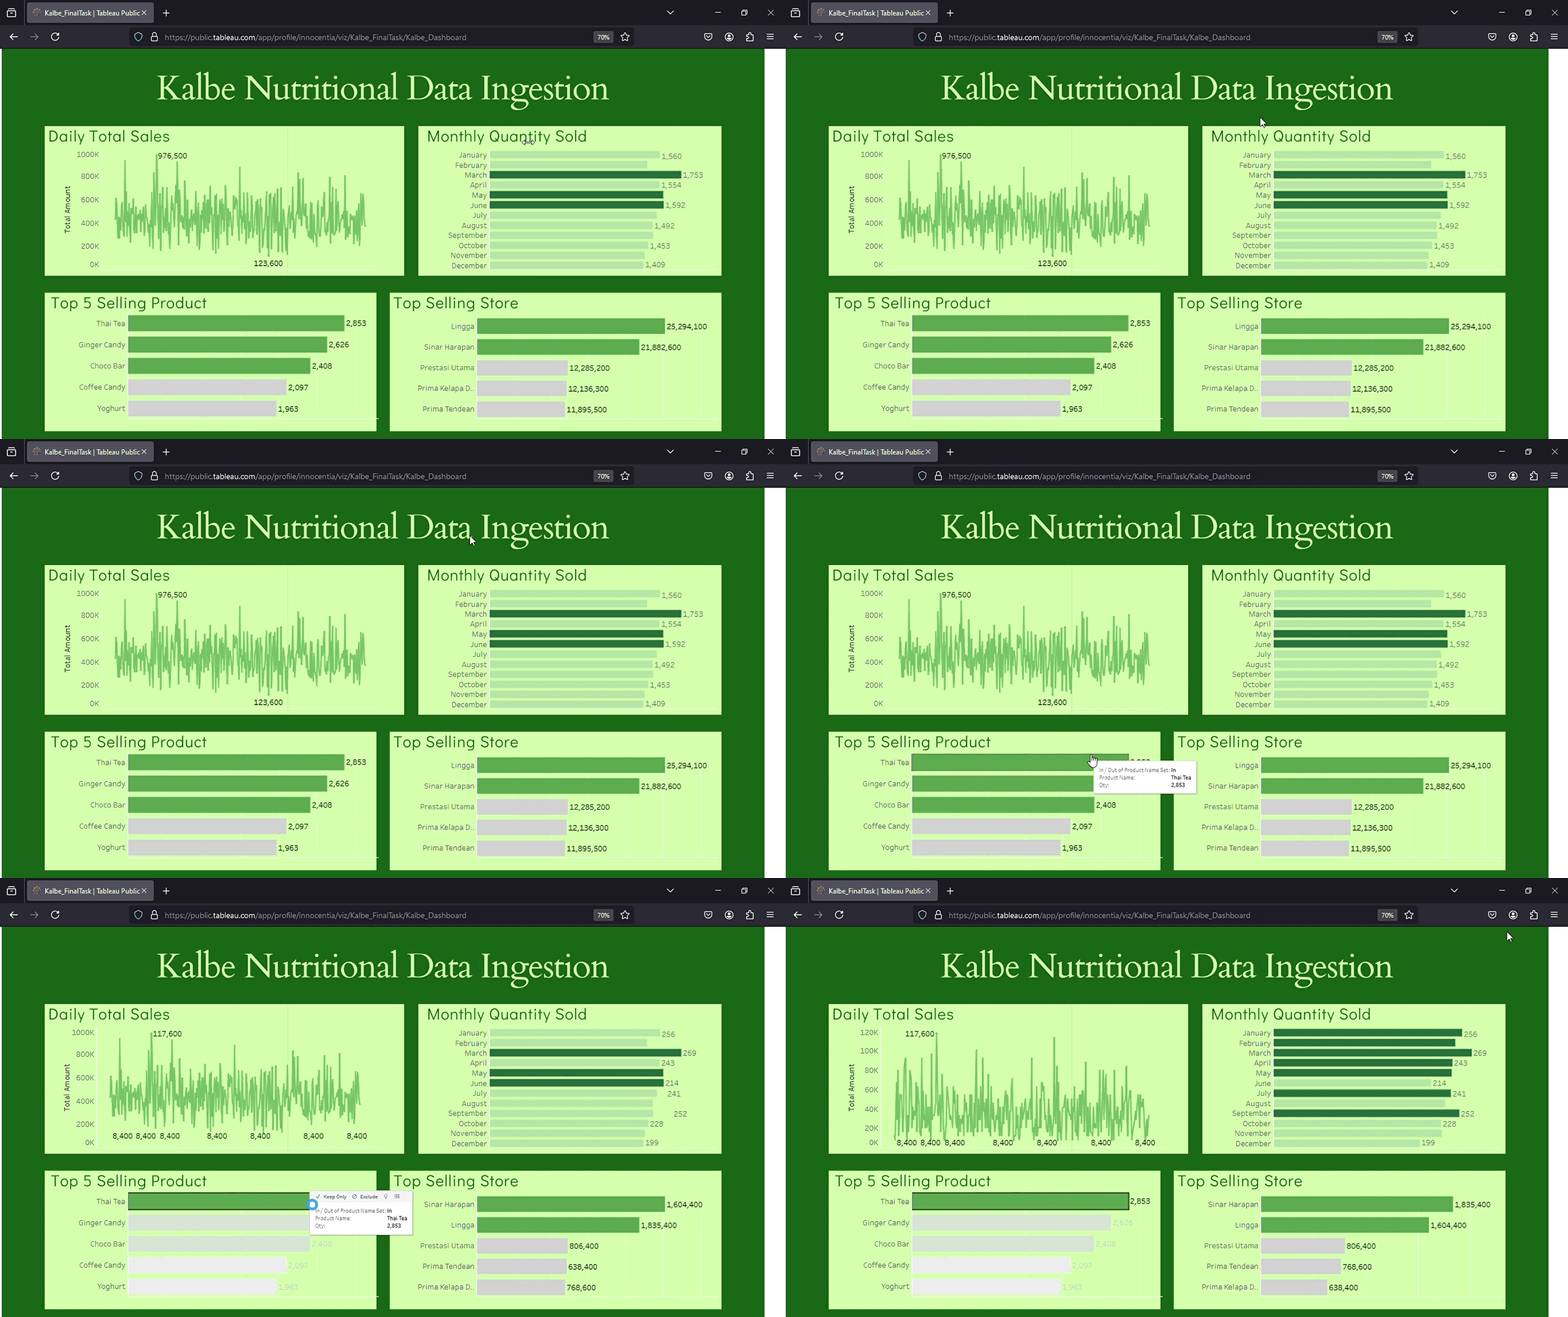
Tableau Dashboard
For interactive use, please visit: Tableau 
Machine Learning
Time Series Model
MAE is found to be 0.24, meaning the model’s forecasts differ from the actual values by approximately 0.24 units. MAPE is 6.53%, meaning the model’s forecasts deviate from the actual values by about 6.53%. MSE is 0.08, meaning the model’s forecasts have, on average, squared differences of 0.08 with the actual values. RMSE is 0.29, meaning the model’s forecasts have a root mean squared difference of approximately 0.29 with the actual values.
Clustering Model
From the 2-cluster division, it is found that in cluster 1, customers have a higher preference for Thai Tea, Ginger Candy, and Oat. Meanwhile, in cluster 0, customers have a higher preference for Cheese Stick, Choco bar, Crackers, and Cashew.
Code source: Github
